Language
We detect your regional language is French. Do you want to change site's language to French? You may choose other languages.International
 English
 中文
中文
 русск
русск
 français
 español
 العربية

- Home
- Symposiums
- The 5th GIS Software Technology Conference
- Webinar on Society 5.0
- IKCEST holds the 8th International Disaster Prevention and Reduction Knowledge Service Seminar
- The 9th International Disaster Prevention and Reduction Knowledge Service Seminar
- The 2022 Newmark Distinguished Lecture
- IKCEST International Symposium 2019
- IKCEST International Symposium 2018
- IKCEST International Symposium 2017
- IKCEST International Symposium 2016
- IKCEST International Symposium 2015
- China-Ukraine Workshop on Resources Classification: Status, Mapping and Application
- UNESCO Science Centres Coordination Meeting
- All Symposium
- Training Workshops
- The 2019 International Workshop of IKCEST Intelligent City Knowledge Service held in Shanghai
- International Training Workshop on Disaster Risk Reduction Knowledge Service in China-Pakistan Economic Corridor
- IKCEST and ISTIC jointly held the Online Training Workshop on Big Data
- TRAINING OF TRAINERS on Data Stewardship for Open Science 2021
- IKCEST-DRR Team Successfully Held the International Training Workshop
- The Belt and Road Initiative International Training Course on Resources, Environment, Scientific Data Sharing and Disaster Prevention and Reduction Knowledge Services
- Program of the Training Workshop On Resource & Environment Scientific Data Sharing and Disaster Emergency Response along CPEC
- International Training Workshop on Big Data for Developing Countries 2019
- The International Training on Resource & Environment Scientific Data Sharing along the “Belt and Road”
- IKCEST - ISTIC 2018 Big Data Training Workshop
- 2019 IKCEST & ICEE International Engineering Education Training Workshop held successfully at Tsinghua University
- The International Training Workshop on Resource & Environment Scientific Data Sharing and Disaster Risk Reduction Knowledge Service
- All Training Workshops
- Competitions
- The 7th IKCEST The Belt and Road International Big Data Competition
- The 6th IKCEST The Belt and Road International Big Data Competition
- The 5th IKCEST The Belt and Road International Big Data Competition
- The 4th IKCEST The Belt and Road International Big Data Competition
- The 3rd IKCEST The Belt and Road International Big Data Competition
- Datasets
- Knowledge Apps
- Knowledge Services
- Videos
- Newsletters
- About IKCEST

Academic Videos
Academic Video provides video content to a broad range of subject areas.
CityIQ
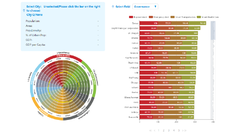
The new CityIQ Knowledge Service integrates data on cities around the world and we have a huge city database as the basis for our CityIQ score. The amount of urban data that this database possesses is one of the largest in the world and integrates the differences in statistical standards between countries, while using advanced technologies and introducing advanced algorithms to keep data dynamic. We provide data query services: Users can view the historical scores of the cities assessed in the database and their respective sub-indicators. At the same time, the smart city evaluation can interact with the user, and the user can submit supplementary corrections for the index of a certain city. After the data review and data reliability verification, the score system can be included. The City IQ data could be shared to the people from every corner of the world freely.

Technology Trends
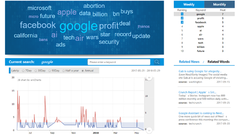
This knowledge application follows the development trends of engineering science and technology focused by UNESCO and IKCEST.
Visualization Tool Kit
Visualization Tool Kit for Big Data
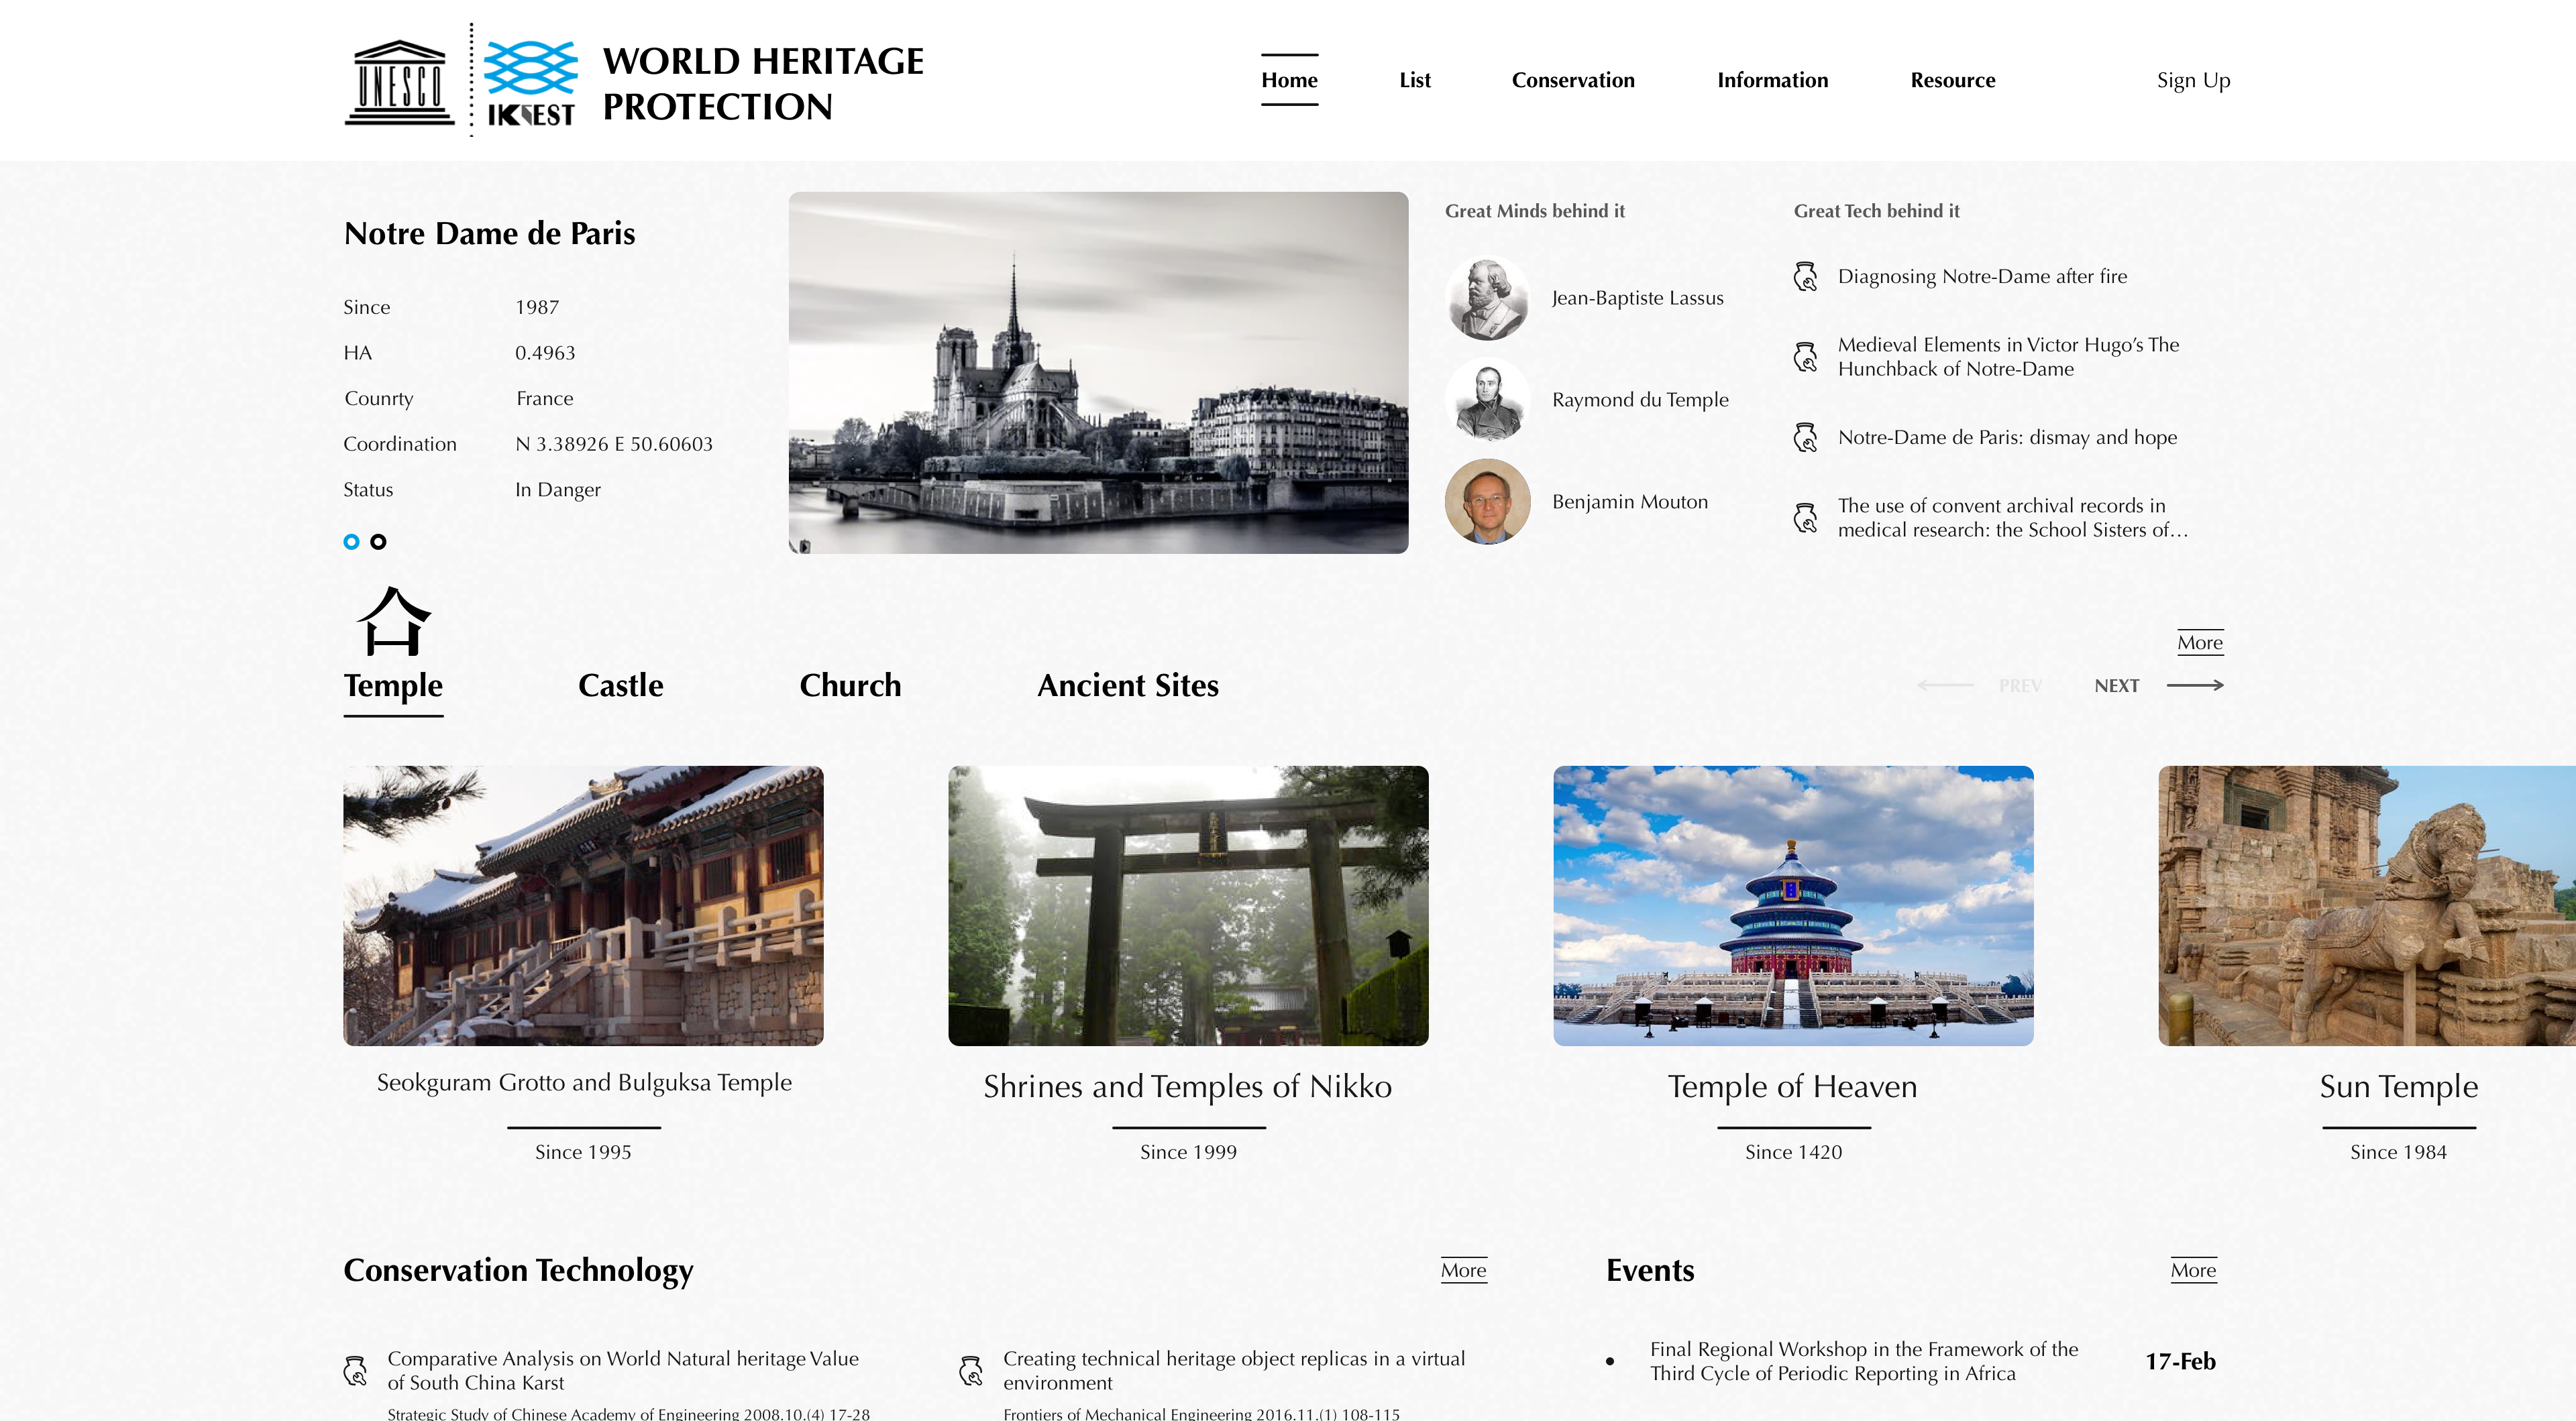
Cultural Heritage Protection
Provide Global Cultural Heritage Infomation
Planning Education
The Planning Education sector is committed to creating the world's best knowledge sharing platform in planning education field. At current stage, it mainly focuses on the sharing function of educational videos including related areas like planning education, smart city, urbanization, smart transport, AI aided planning, etc. The platform plans to introduce the latest AI technology, embed AI language translation module to achieve initial bilingual Chinese-English translation, relying on artificial intelligence translation technology, it gradually eliminate language barriers, so that learners can access the educational resources of all languages without barriers.

Knowledge Service of Annual Spatial Distribution Data Service for Drought Monitoring in Mongolian Plateau (1981-2012)
The vegetation degradation, drought and other environmental issues in the Mongolian Plateau have been as the hot spot in the study of the climate change and the ecological environment changes in Northeast Asia. Based on the NOAA AVHRR NDVI-PathFinder 10d remote sensing data of 1981-1999 and MODIS vegetation index and the surface temperature 16d data of 2000-2012, the knowledge service inverted Temperature and Drought Vegetation Index (TVDI) by the Ts-NDVI general space, their spatio-temporal distribution and changes were calculated.
With the WebGIS technology, the application of Mongolian Plateau drought monitoring annual spatial distribution has been released. This application shows Mongolian Plateau drought monitoring annual spatial distribution from 1981 to 2012. MapServer is used to release Web Map Service (WMS) referring the international specification. The Combination of data and MapBox tiles has been used by OpenLayers to generate the map view. When the app page opened, the satellite image could be visualized as the map service. In the map operation on the right side of the app page, users can select different years to view the corresponding data map.
Selecting GIS data operation in the sidebar navigation, users can see the corresponding option of year and click the drop-down arrow to display the year lists, including the years from 1981 to 2012. In the bottom right corner of the app page, users can see application-related documents and information which are classified by label control. The user can choose “more” to get more readings.

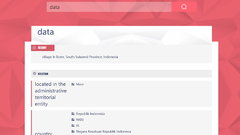
IKCEST EST Terms Query Tool
Online Query Tool for IKCEST EST Terms
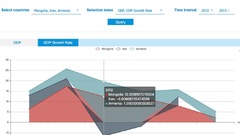
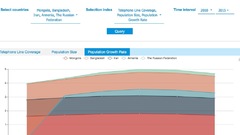
Macroeconomic Database of the Belt and Road
This Macroeconomic Database select many macroeconomic data indexes of all the counties along the Belt and Road in order to give reader a access to get related countries’ economic data. On the other hand, this database can also reflect those countries’ fast development in recent six years, due to the Belt and Road.
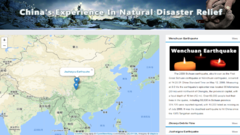
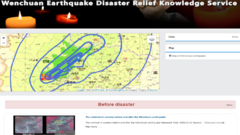
China and International Experience in Natural Disaster Relief
China is one of the countries with the most serious natural disasters in the world. Facing sudden major natural disasters, China has taken much effective disaster relief and got rich experiences in the past several serious disasters, and received widespread attention and praise from international society. Therefore, it is necessary to collect these typical disaster relief cases and share China’s nature disaster relief experiments to the world. This knowledge application tries to collect the knowledge information about the prevention before disaster, rescue in disaster and restoration after disaster. The Wenchuan earthquake, Zhouqu debris flow, and Jiuzhaigou earthquake are selected as typical cases. Serials of data, maps, pictures, videos, papers, planning reports and other related information about these cases are integrated in the content web interfaces.
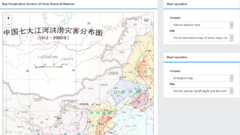
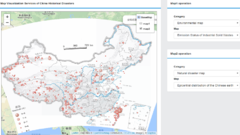
Map Visualization Services of China Historical Disasters
Map Visualization Services of China Historical Disasters
Desc: The DRR platform has published a lot of scanned maps online. Disaster maps of China are listed in the app page. User could get China historical disaster information from visualized maps which was developed based on WebGIS technology.
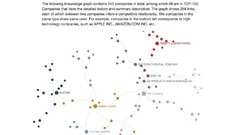
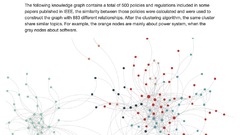
Knowledge Graph
The Silk Road knowledge graph covers diverse domains from sciences to government data. Users are able to use the knowledge graph to resolve their query and assemble the information by themselves without having to navigate to other sites in a straightforward prospective.
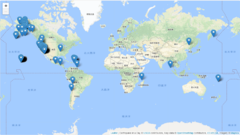
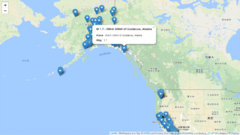
Global Earthquake Daily Distribution Map Service
The global daily earthquake data is fetched via the interface of USGS. Using Leafletjs to combine the data and MapBox tiles to generate the map view. When the app page opened, the daily realtime earthquake information can be visualized in the map services.
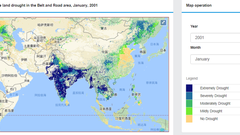
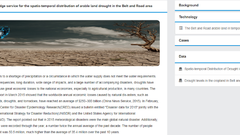
The Belt and Road Arable Land in Temporal and Spatial Display
Considering the urgent demand for the spatio-temporal distribution of drought disasters over long periods of time in the Belt and Road region, this knowledge service utilized the Tropical Rainfall Measuring Mission satellite (TRMM) precipitation data to calculate the monthly spatio-temporal distribution of drought in the Belt and Road arable area from 2001 to 2013 based on the Precipitation Abnormity Percentage drought model.
This application shows the monthly spatio-temporal distribution of the drought from 2001 to 2013. MapServer is used to release Web Map Service (WMS) referring the international specifications and standards. The combination of data and MapBox tiles are used by LeafletJS to generate the GIS map view. When the app page is opened, the GIS map could be visualized as the map service.
Selecting GIS data operation in the sidebar navigation, users can see the corresponding options (year and month) and click the drop-down arrow to display the year and month lists, including the years from 2001 to 2013, and the months from January to December. Additional links (e.g. Data) are listed in the app page for users to get more related resources.


Knowledge Map Service of Major Organization for Disaster Risk Reduction
The majority organizations of disaster risk reduction have been collected and stored in the DRR platform. The data for the organization has been transferred into GeoJson format, had then been displayed on the map tiles of MapBox. User could find the organization by position on the map and get more navigation information (will be done later).
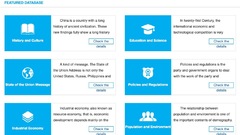
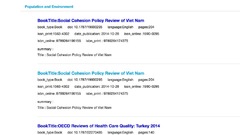
Featured Database
The featured database mainly refers to the six databases collected by the SRST Knowledge Service platform. Six featured databases collect mainly the “The Belt and Road Initiatives” countries’ multidisciplinary electronic resources, including journals, conferences, patents, monographs, standards and other document types for global users.
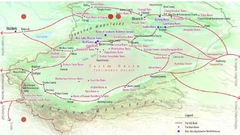
University Alliance of the New Silk Road
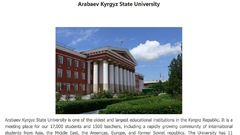
The University Alliance of the New Silk Road is a university alliance formed by Xi'an Jiaotong University and founded on May 22, 2015, with 128 universities from 31 countries. This module provides 128 web portals of the partner universities and displays the achievements in scientific research and relative papers.
Knowledge Service of Spatial Distribution of the Seasonal Chlorophyll-a Concentration in Poyang Lake, China (2009-2012)
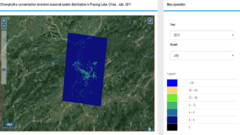
Poyang Lake is the largest freshwater lake in China, and it plays an important role in flood control regulation and storage and biodiversity protection.Water eutrophication in Poyang Lake has been considered to be an obstacle to aquatic environment protection and regional sustainable development. Chlorophyll-a concentration is one of the most important indices of water eutrophication. This application builds seasonal chlorophyll-a concentration retrieval models using a semi-analytical model. Quarterly distributions of chlorophyll-a concentration from 2009 to 2012 are explored using multi-spectra data from a moderate-resolution imaging spectroradiometer (MODIS).
With the WebGIS technology, the application of spatial distribution of the seasonal chlorophyll-a concentration in Poyang Lake, China (2009-2012) has been released. This application shows the measured chlorophyll-a concentration data in January, April, July, and October from 2009 to 2012. MapServer is used to release Web Map Service (WMS) referring the international specification. The Combination of data and MapBox tiles has been used by OpenLayers to generate the map view. When the app page opened, the satellite image could be visualized as the map service. In the map operation on the right side of the app page, users can select different years and months to view the corresponding data map.
Selecting GIS data operation in the sidebar navigation, users can see the corresponding options (year and month) and click the drop-down arrow to display the year and month lists, including the years from 2009 to 2012, and the months include January, April, July, and November. In the bottom right corner of the app page, users can see application-related documents and information which are classified by label control. The user can choose “more” to get more readings.
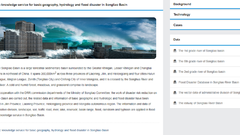
Flood Control Spatial Information Service in Songliao Basin, China
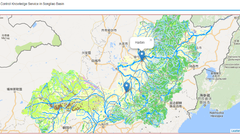
The Songliao Basin, China is crossed by the Songhua River and Liaohe River, spans 260,000 sq.km. across three provinces of Liaoning, Jilin, and Heilongjiang and four cities-Hulun Buer League, Xing'an League, Zenith (Tongliao City) and Chifeng City of Inner Mongolia. A cold and humid forest, meadows, and grassland comprise its landscape. The flood and waterlogging disasters in Songliao Basin has high frequency and wide range characteristics, and the loss of the disaster is aggravating year by year.
Based on the reconnaissance and analysis technology, the spatial information and data of administrative division, landscape, soil, traffic road, river, lake, reservoir, basin range, flood, rainstorm and typhoon are preceded and sorted in this application. MapServer is used to release Web Map Service (WMS) referring the international specifications and standards. The combination of data and MapBox tiles are used by LeafletJS to generate the GIS map view.
When the app page is opened, the GIS map could be visualized as the map service. The documents and information of basic geography, hydrology and flood disaster are classified and sorted by label control. Additional links for related resources are listed in the app page.
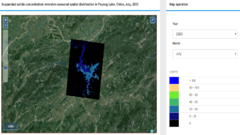
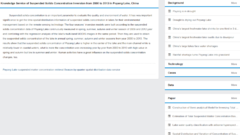
Knowledge Service of Suspended Solids Concentration Inversion from 2000 to 2013 in Poyang Lake, China
Concentrations of suspended solids in lakes can affect the latter’s primary productivity and reflect changes in sediment deposition. Determining the temporal and spatial distribution of suspended solid concentrations has important significance in lake water environmental management; this is particularly urgent for Poyang Lake, the largest freshwater lake in China. In this application, suspended solid concentration inversion models for Poyang Lake were created using a semi-empirical method with regression analysis between continuously measured suspended solid concentration data and multi-band moderate-resolution imaging spectroradiometer images for spring, summer, autumn, and winter from 2009 to 2012. The seasonal distributions of suspended solid concentrations in Poyang Lake from 2000 to 2013 were then obtained using optimal reversal models.
With the WebGIS technology, the application of spatial distribution of the seasonal suspended solids concentration in Poyang Lake, China (2000-2013) has been released. This application shows the measured suspended solid concentrations data in January, February, April, July, October and December from 2000 to 2013. MapServer is used to release Web Map Service (WMS) referring the international specification. The Combination of data and MapBox tiles has been used by OpenLayers to generate the map view. When the app page opened, the satellite image could be visualized as the map service. In the map operation on the right side of the app page, users can select different years and months to view the corresponding data map.
Selecting GIS data operation in the sidebar navigation, users can see the corresponding options (year and month) and click the drop-down arrow to display the year and month lists, including the years from 2000 to 2013, and the months include January, April, July, and October,. In the bottom right corner of the app page, users can see application-related documents and information which are classified by label control. The user can choose “more” to get more readings.
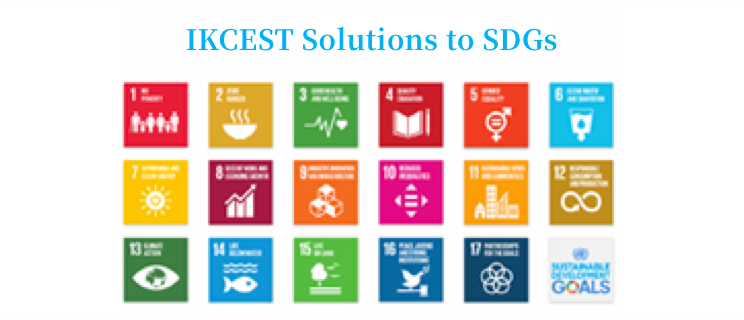
IKCEST Solutions to SDGs
Supporting UNESCO Sustainable Development Goals.

The Belt and Road Index
The Index for the countries along the belt and road.

Women Scientists
The world needs engineering&science and engineering&science needs women because they have the power to change the world.

Global Engineering Projects
Built work demonstrates a combination of those qualitites of talent, vision and commitment.
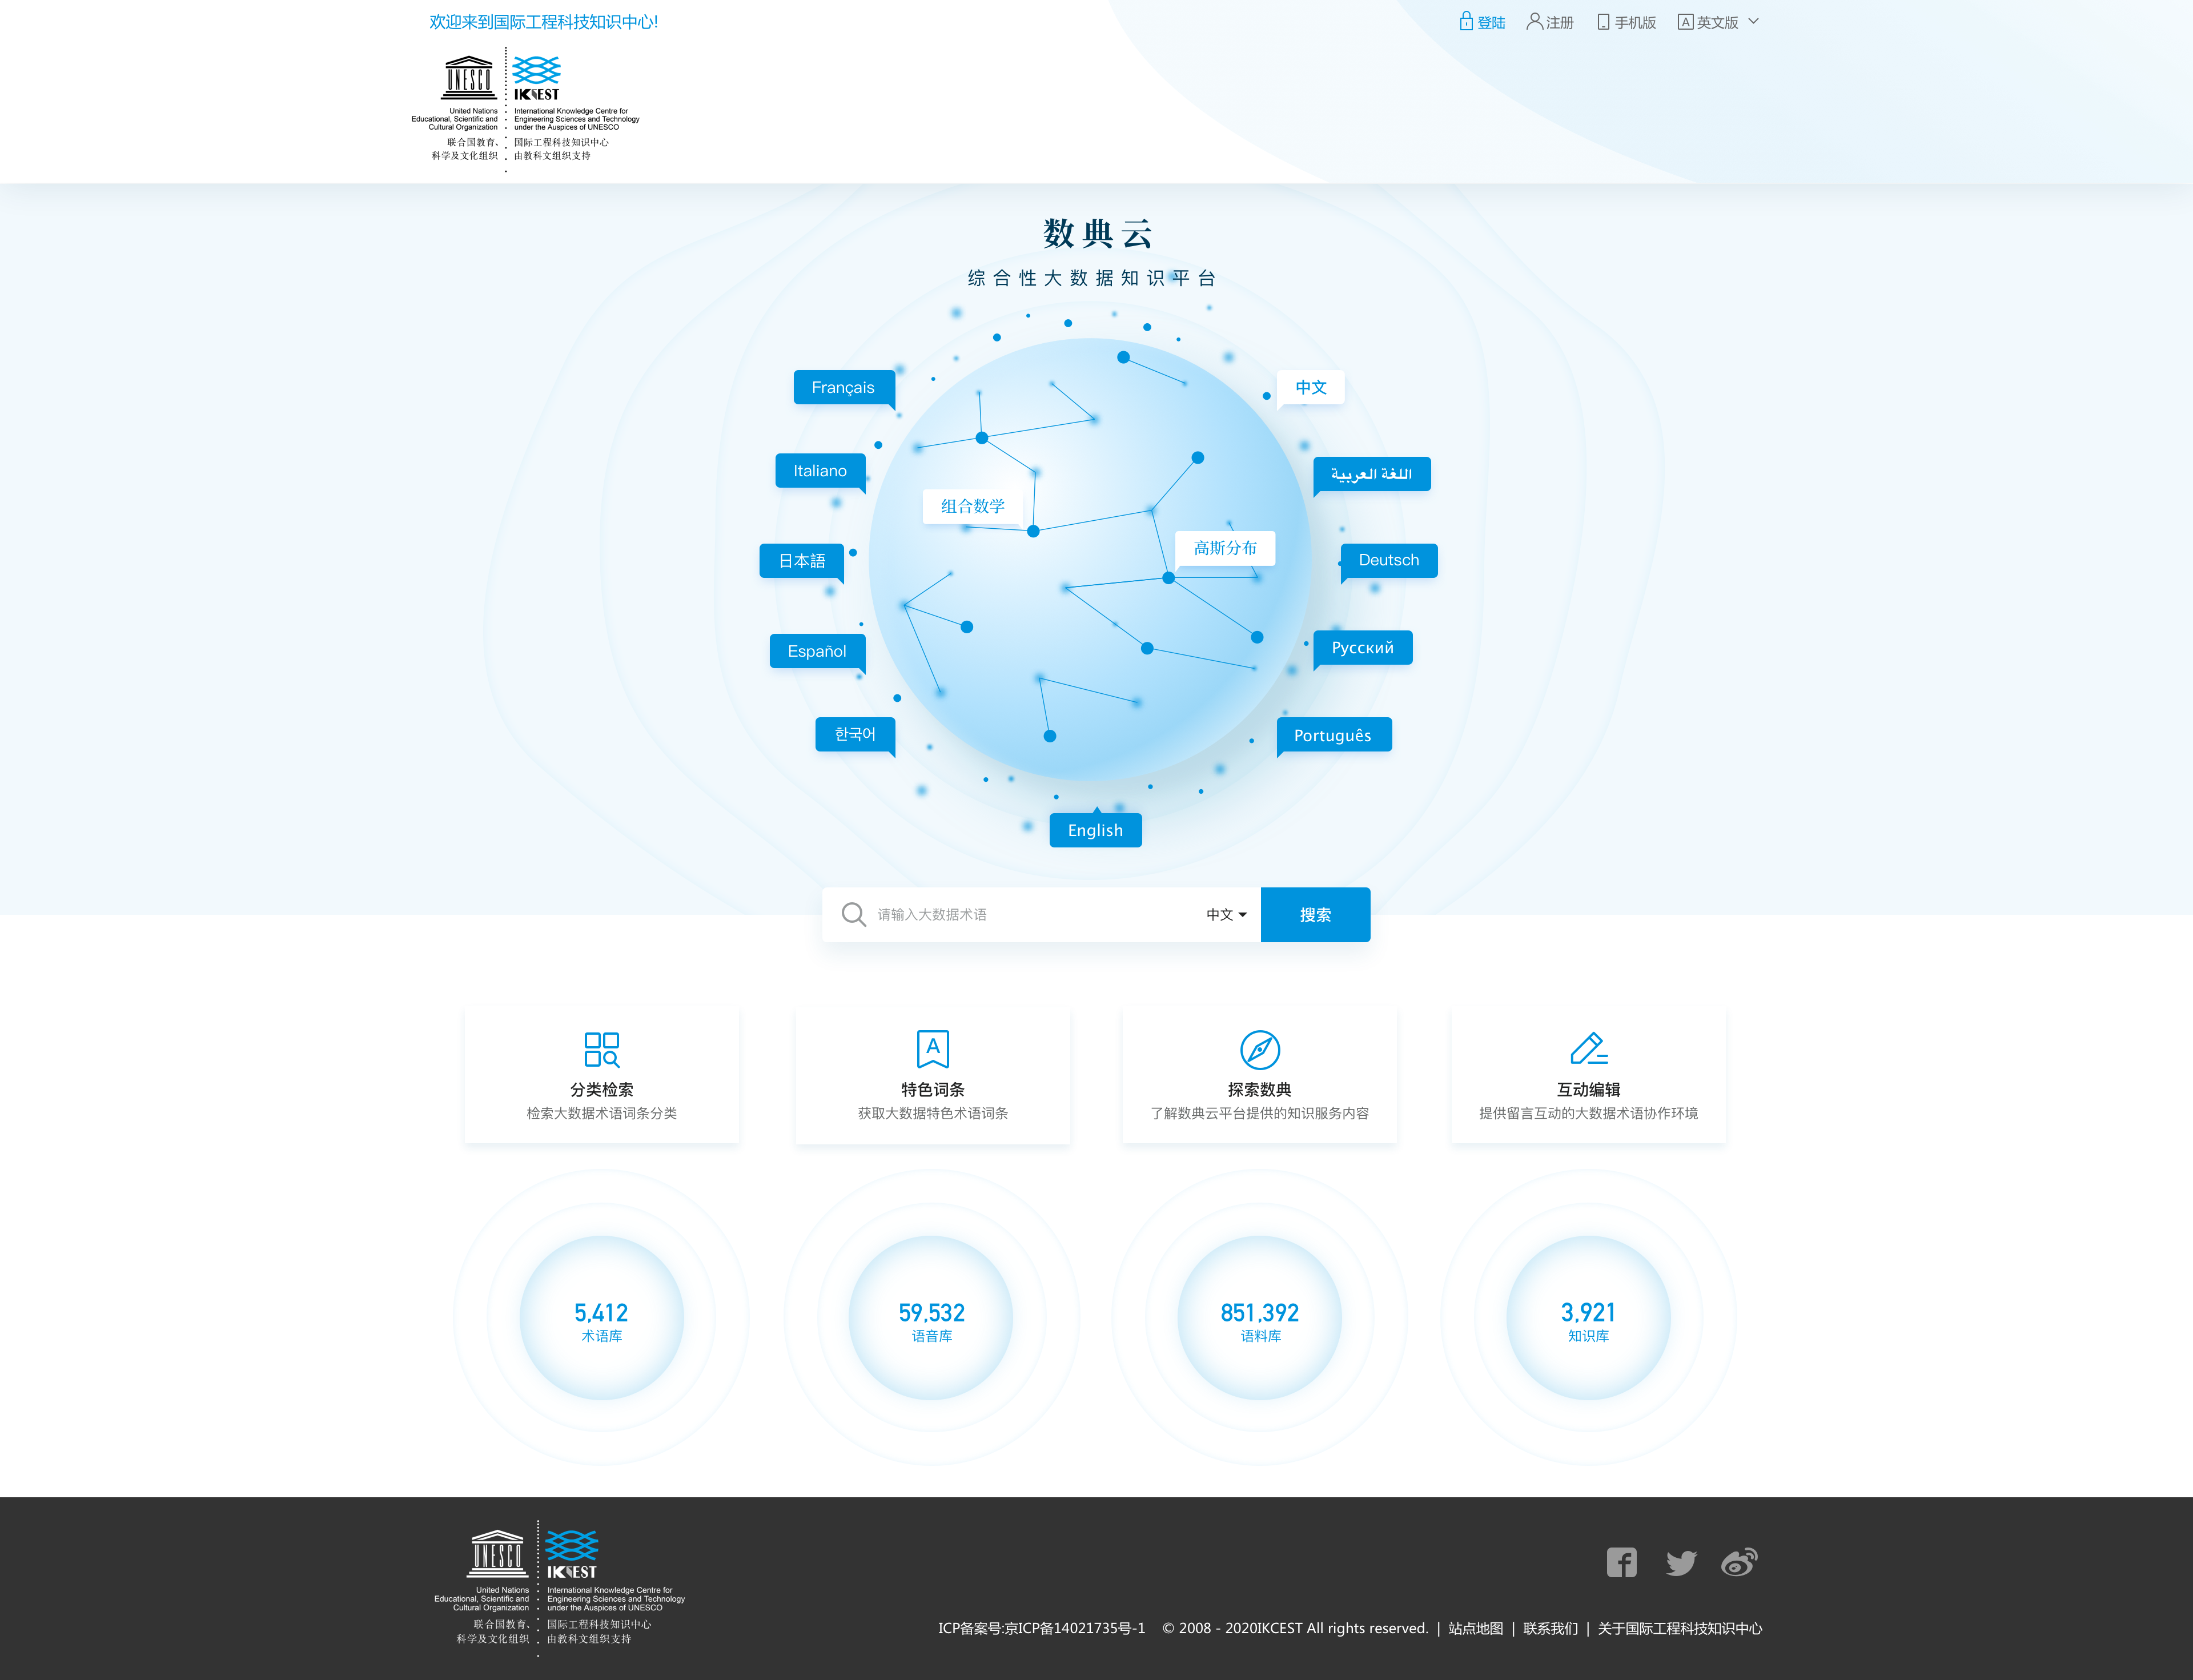
Big Data Term Encyclopedia
Big Data Multilingual Encyclopedia Term Knowledge Service Platform.
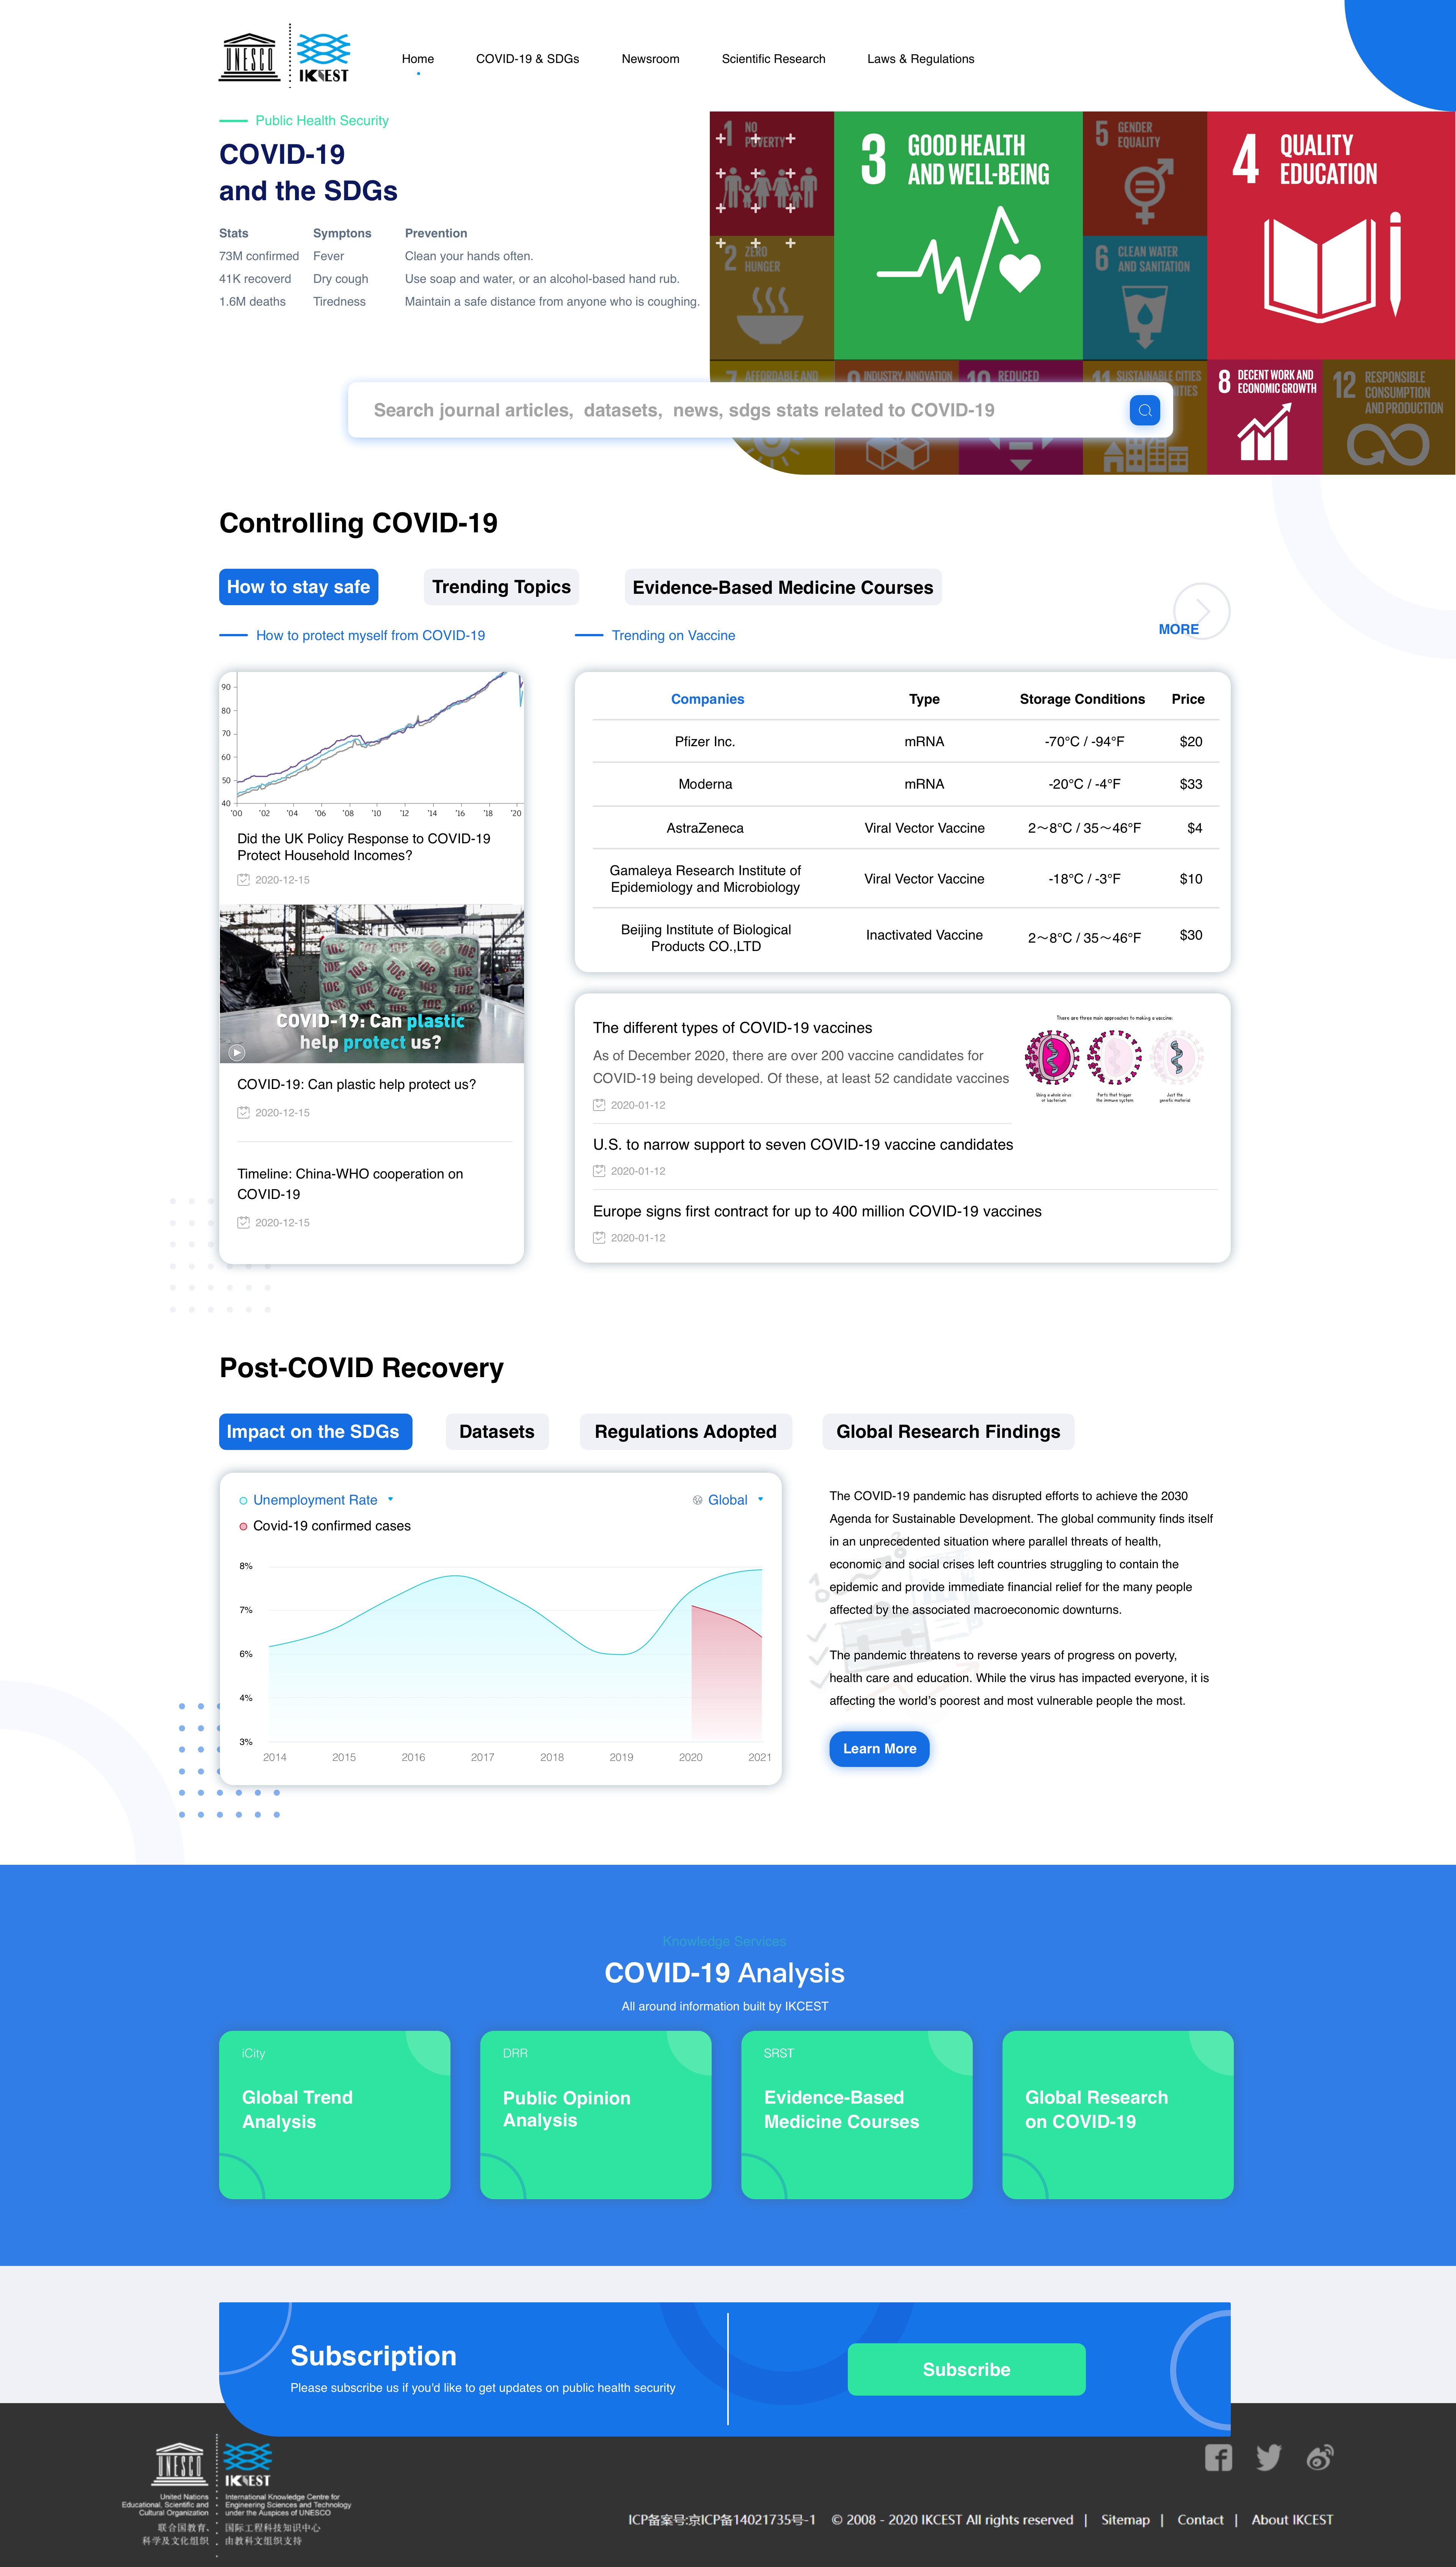
Public Health Security
A key driver in the effort to strengthen global public health security is the framework of the newly revised International Health Regulations.

AI Ethics
The ethics of artificial intelligence is the branch of the ethics of technology specific to artificially intelligent systems.
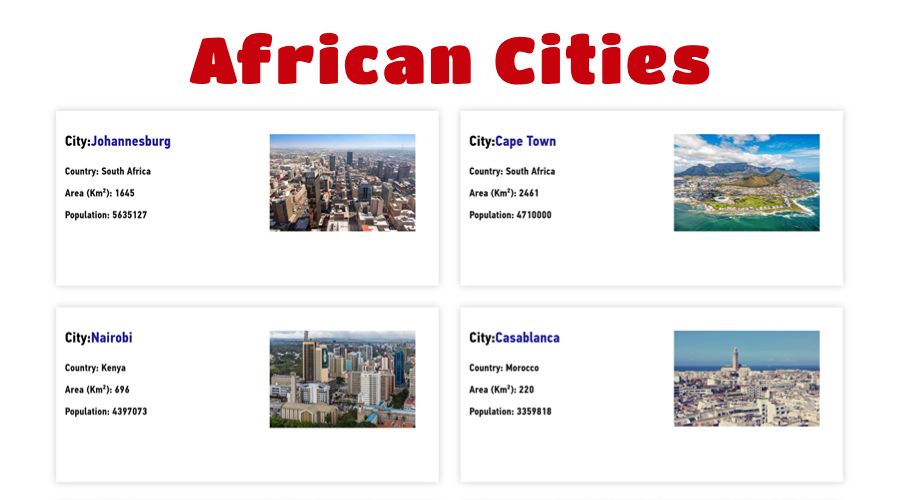
African Cities
African cities have made great progress over the years, focusing on the development of excellent African cities and promoting their successful experiences.
Traditional Chinese Medicine
Traditional Chinese Medicine (TCM) is a holistic approach to health and wellness that has been practiced for thousands of years. This application aims to leverage the unique characteristics and strengths of Chinese medical resources to contribute to the advancement of global health.
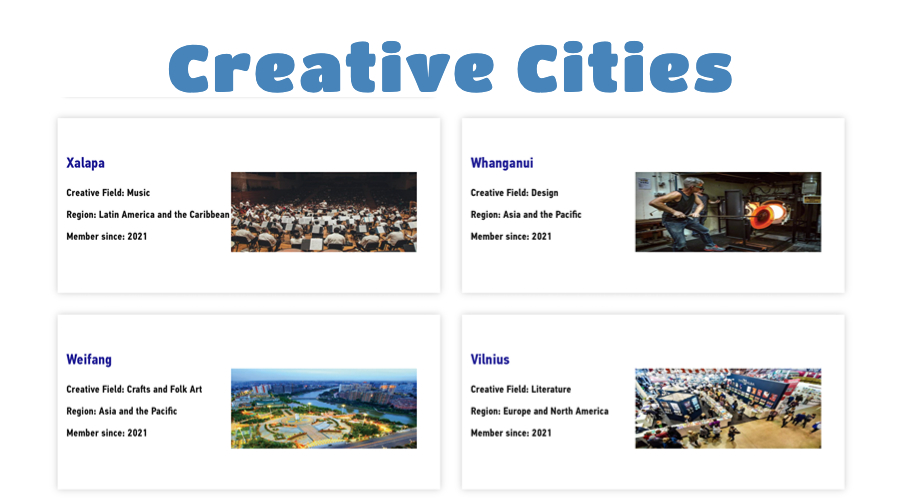
Creative Cities
The Creative cities Knowledge Service is committed to giving play to the role of global creative industries in promoting the economy and society.
Open Science
Open Science is a critical accelerator for the achievement of the United Nations Sustainable Development Goals and a true game changer in bridging the science, technology and innovation gaps and fulfilling the human right to science.
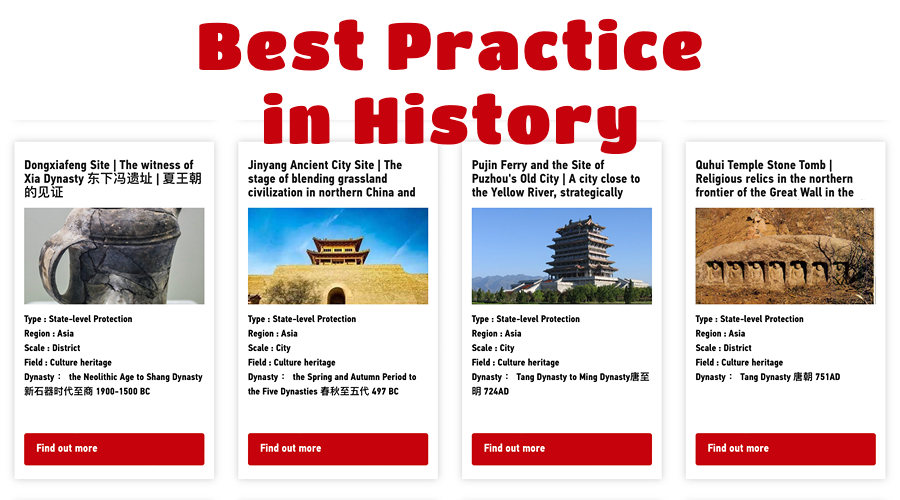
Best Practice in History
The Best Practice in History Knowledge Service reflects the ideas and values of excellent urban design and construction in human history.
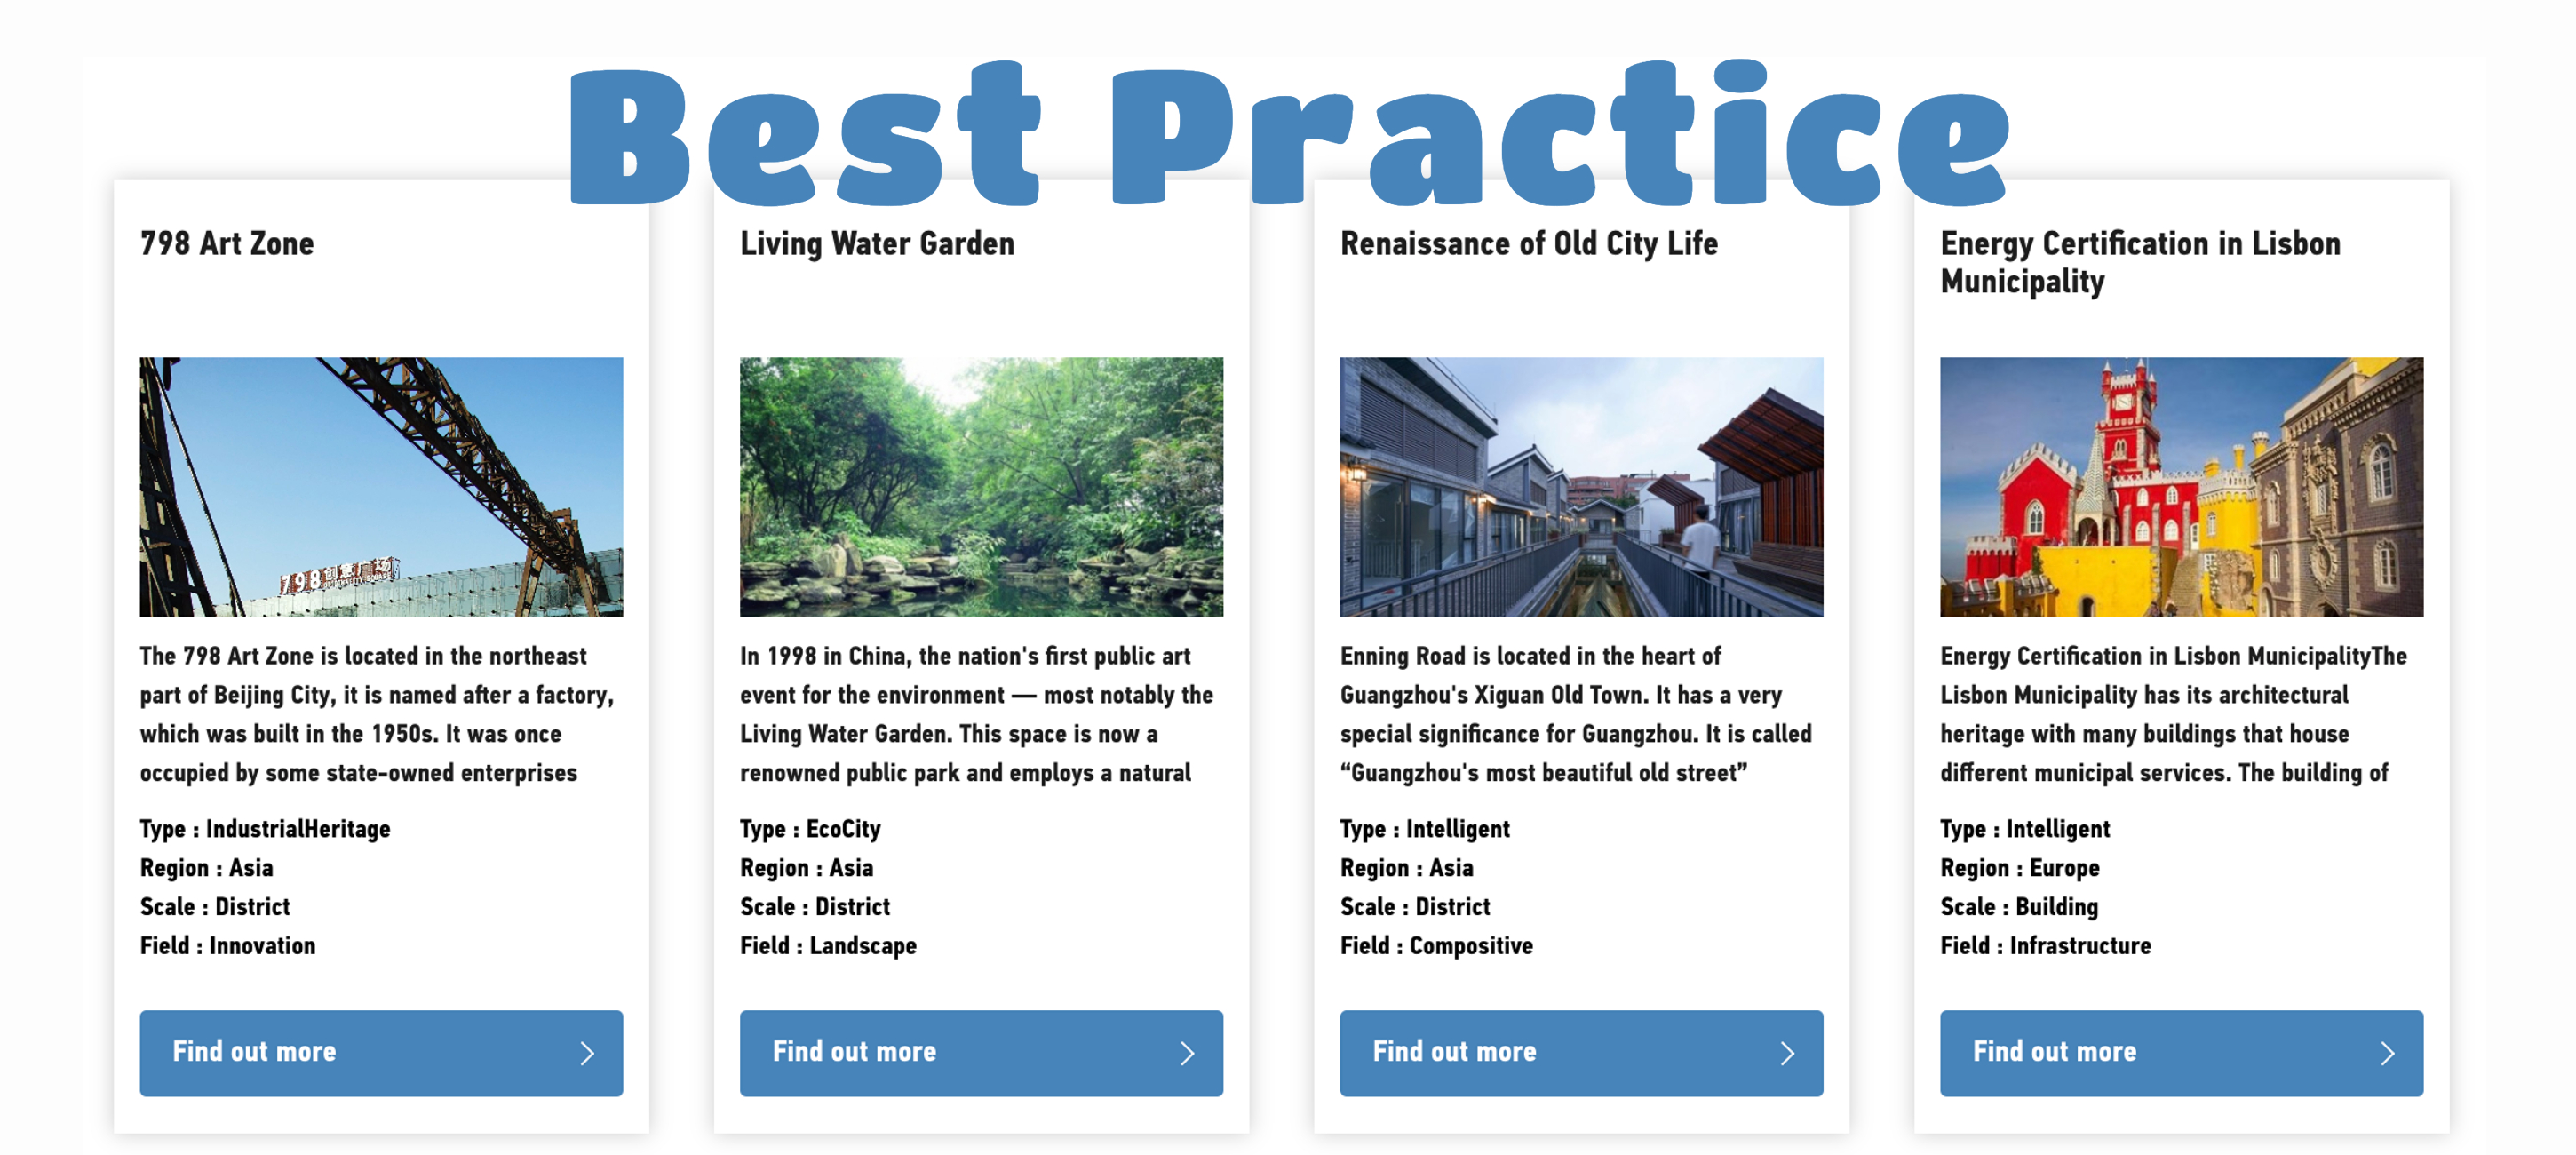
Best Practice
The Best Practice Knowledge Service focuses on comprehensive global urban design and construction practice, plays a leading and exemplary role in future urban development.
Reports
Reports
Ramsar
Ramsar
SDG 11
SDG 11
Forest freezing, rain and snow disaster prevention and reduction in southern China
Forest freezing, rain and snow disaster prevention and reduction in southern China
Total Factor Data of Land Cover in Disaster Pregnancy Environment in Mongolia
Total Factor Data of Land Cover in Disaster Pregnancy Environment in Mongolia
Spatio-temporal Distribution of Major Historical Disasters in the China-Mongolia-Russia Economic Corridor
Spatio-temporal Distribution of Major Historical Disasters in the China-Mongolia-Russia Economic Corridor
Temporal and Spatial Distribution of Public Sentiment on Shouguang Flood
Temporal and Spatial Distribution of Public Sentiment on Shouguang Flood
"Belt and Road" disaster-prone environment data knowledge service application
"Belt and Road" disaster-prone environment data knowledge service application
Grassland yield in China-Mongolia-Russia Economic Corridor
Grassland yield in China-Mongolia-Russia Economic Corridor
Knowledge application of COVID-19 epidemic public opinion analysis
Knowledge application of COVID-19 epidemic public opinion analysis
Desertification monitoring in Mongolia section of China-Mongolia railway
Desertification monitoring in Mongolia section of China-Mongolia railway
Disaster knowledge application of China Pakistan Economic Corridor
Disaster knowledge application of China Pakistan Economic Corridor
Historical meteorological space mapping in the Belt and Road
Historical meteorological space mapping in the Belt and Road
Global earthquake spatial distribution mapping since 2150 BC
Global earthquake spatial distribution mapping since 2150 BC
Multi-scale assessment of heat wave disaster risk in typical region-case study in Dhaka, Bangladesh in South Asian
Multi-scale assessment of heat wave disaster risk in typical region-case study in Dhaka, Bangladesh in South Asian
Natural disaster risk assessment on agricultural production over Heilongjiang - Amur Transboundary River Basin
Natural disaster risk assessment on agricultural production over Heilongjiang - Amur Transboundary River Basin
Information Retrieval based on World Countries and Regions Map
Information Retrieval based on World Countries and Regions Map
Online Research Collaboration System
Online Research Collaboration System
Flood Disaster Knowledge Graph
Flood Disaster Knowledge Graph
Application of knowledge on flood risk assessment in Dhaka city
Application of knowledge on flood risk assessment in Dhaka city
Scholars
Scholars
Projects
Projects


Your level privilege is in sufficient. You can go to the “User Center” to view your level information and perform points tasks to upgrade your level.
New sign-in location:
Last sign-in location:
Last sign-in date:

About to jump to an external site.
Security unknown, whether to continue

 User Center
 My Training Class
 Feedback


